
Sorry. We did not find anything.
Growing Malatang Earnings takes more than a crowded dining room. A shop can serve bowls all evening and still lose margin through oversized portions, food waste, or poorly scheduled shifts. These seven tips examine the practical levers owners can measure: ingredient costs, menu design, pricing, service speed, repeat visits, and daily cash flow. Small details matter. A ladle that adds too much broth, or a fridge left overstocked after lunch, can quietly change the numbers.
Zhang Liang, founder of Zhang Liang Malatang, offers a relevant operator’s perspective. I cannot verify a published quotation from him on this specific topic, so I will not present invented words as his. Instead, this guide uses a clearly labeled working principle: “A busy shop is not necessarily a profitable shop; track what each bowl costs.” Treat it as a practical test, not a direct quotation. Compare purchase records with sales, check portion sizes during rush periods, and review which ingredients sit unsold at closing.
The tips that follow focus on actions owners can test without assuming every shop has the same customers or rent. Results vary by location, supplier terms, and operating hours. Some changes may even disappoint; a higher price can reduce orders, while a larger menu can increase waste. That is worth noticing. Use the numbers, listen to customers, and adjust one change at a time.
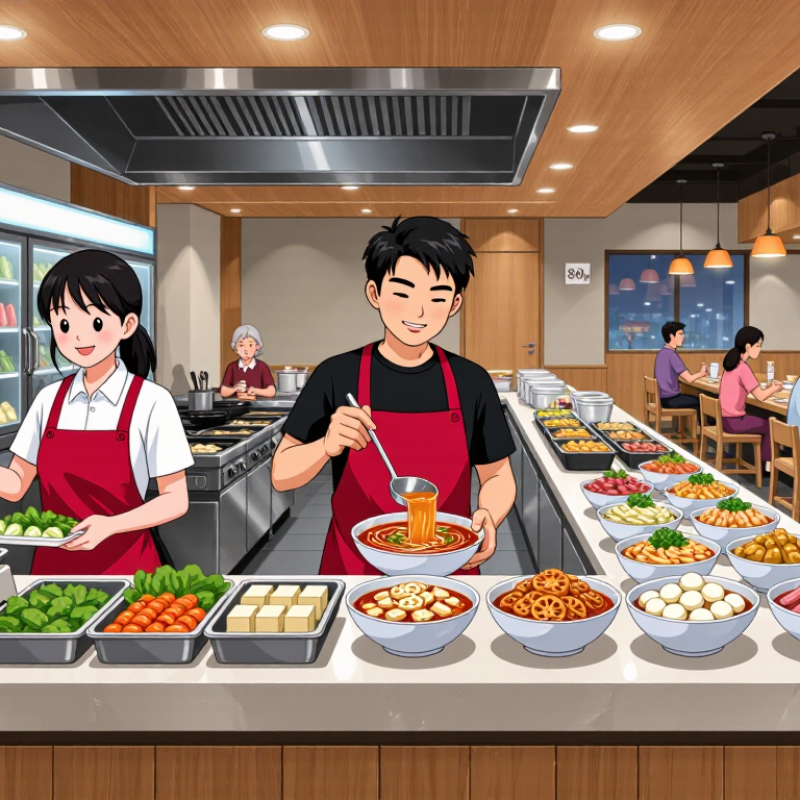
The National Restaurant Association’s 2024 Restaurant Operations Data Abstract reports median income before taxes of 2.8% of sales for full-service restaurants, compared with 4.0% for limited-service restaurants. These are U.S. benchmarks, not guaranteed malatang results. On $100 in sales, the 1.2-point gap equals $1.20. Small leaks add up. A malatang shop may combine self-selected ingredients, variable-weight bowls, and table service, so compare its costs with the right operating model before setting a target. The USDA Economic Research Service’s Food Price Outlook can also help operators track pressure on ingredient costs.
Seven practical levers can protect that thin margin: weigh portions consistently, review supplier invoices, remove ingredients that spoil often, price premium items clearly, schedule staff around hourly demand, speed up checkout during rushes, and check daily sales against food and labor costs. A scale beside the serving line and a dated waste log make problems visible. I would not pretend every gram is controllable; busy shifts get messy. Still, test one change at a time and compare results over several weeks. If sales rise but earnings do not, inspect portion sizes, waste, and labor hours before assuming prices are the problem.
UNEP estimated that 1.05 billion tonnes of food were wasted worldwide in 2022, across households, food service, and retail. That figure cannot tell a malatang operator how much food is lost in one kitchen. It does show why careful preparation matters. A tray of wilted greens or a bucket of broth left unused can quietly reduce earnings.
Track what goes into the bin for one week. Weigh discarded vegetables, tofu, noodles, and prepared broth separately. Small details help: note whether waste came from over-trimming, large batches, or slow sales. Then prep popular ingredients in smaller rounds and refill trays as needed. Keep a simple daily record. It need not be perfect.
Use clear labels and first-in, first-out storage so older ingredients are used before newer deliveries. Check portions with a ladle or scale; “a little extra” can become costly across dozens of bowls. Follow safe storage temperatures and discard food that cannot be safely served. Less waste is useful. But cutting portions too far may disappoint customers, and I would review that trade-off instead of assuming every saving is a good one.
| Topic | Data or practice | Application to a Malatang Kitchen |
|---|---|---|
| Global food-waste context | ||
| Food wasted globally in 2022 | Approximately 1.05 billion tonnes of food waste were generated at household, food-service, and retail levels. | Food waste is a significant global issue. Use the figures as context, not as a measure of any individual restaurant’s waste. |
| Households | About 631 million tonnes, or 60% of the total. | UNEP’s household figure is not a restaurant benchmark; track kitchen waste separately from customer-side waste. |
| Food service | About 290 million tonnes, or 28% of the total. | Restaurants are part of the food-service sector, making careful purchasing, preparation, and storage relevant waste-control areas. |
| Retail | About 131 million tonnes, or 12% of the total. | Coordinate ingredient purchasing and delivery schedules to reduce the risk of stock expiring before use. |
| Seven practical tips — track results in your own kitchen | ||
| 1. Forecast demand by day and time | Compare the number of portions prepared with portions sold for each service period. | Use recent sales patterns, weekday differences, and known local events to plan smaller, more frequent prep batches. |
| 2. Prep in small batches | Record the amount prepared, sold, and left over for high-waste ingredients. | Prepare another batch when needed instead of filling the display with more ingredients than expected demand requires. |
| 3. Standardize portion sizes | Check serving weights or counts against a consistent portioning guide. | Use portion tools and clear staff instructions so ingredient use and customer servings are consistent. |
| 4. Rotate stock using FIFO | Log delivery dates and use the “first in, first out” approach for ingredients with different arrival dates. | Place older suitable stock at the front and label containers with preparation or opening dates. |
| 5. Improve storage and labeling | Check storage conditions and discard reasons; follow local food-safety requirements. | Keep ingredients covered, correctly stored, and clearly labeled to help prevent spoilage and avoidable disposal. |
| 6. Review the menu and ingredient overlap | Compare ingredient usage across menu items and identify ingredients with frequent leftovers. | Where practical, design menu options that share suitable ingredients, while maintaining food-safety controls and customer choice. |
| 7. Weigh and review prep waste | Record discarded food by ingredient, quantity, and reason; review the log regularly. | Use the records to adjust purchasing and prep quantities. Compare waste and food cost over time rather than assuming a profit increase. |
| Source: United Nations Environment Programme (UNEP), Food Waste Index Report 2024, reporting global food-waste estimates for 2022. Sector figures are rounded. The kitchen practices above are operational suggestions; results depend on each business’s records, demand, costs, and food-safety requirements. | ||
Tip: Cost each bowl by weighing ingredients, not by guessing. Record the portion of broth, noodles, vegetables, meat, and sauce that a typical customer takes. Include packaging and cooking energy where practical. A scale beside the prep station makes portion checks easier. Small leaks add up. Review supplier prices often, since a few cents per serving can change the margin.
Tip: Track add-on rate at the register. Note how often customers choose items such as extra noodles, tofu, or leafy greens. Compare each add-on’s selling price with its ingredient cost. A popular extra is not automatically profitable. If few customers choose a costly topping, adjust its portion or price, then watch the response. Keep changes modest; one busy evening can mislead you.
Tip: Calculate contribution margin for a bowl: selling price minus variable costs. Compare that figure across common bowl sizes and popular add-ons. Use actual sales records from several weeks, not a single rush period. The estimate will still be imperfect. Waste, uneven portions, and quiet days complicate the picture. Recheck the numbers monthly, and change prices only when the evidence supports it.
CNNIC’s 53rd Statistical Report on China’s Internet Development counted 545 million online food-delivery users in China by December 2023. That represented 49.9% of the country’s internet users. For a malatang shop, this is a large potential audience, not a promise of sales. Customers still compare delivery time, menu clarity, fees, and reviews before ordering.
Tip: Build a delivery-friendly menu. List broth, spice level, and ingredient weights clearly. Offer a few fixed combinations for customers who do not want to choose every item. Keep popular ingredients stocked, but review sales weekly; unsold toppings can quietly erode margins. Use leak-resistant containers and test them with broth before relying on them. Small details matter.
Tip: Track each order’s real contribution. Include ingredients, packaging, platform charges, discounts, and refunds—not just the food cost. CNNIC’s user figure shows the channel’s scale, but it does not reveal your local demand or profit. Start with a limited delivery radius and compare busy-hour preparation times with customer feedback. A wider reach may bring more orders, yet delays can weaken ratings. I would not assume one promotion fixes that. Look for repeat-order patterns, then adjust portions, bundles, or operating hours carefully.
Tip: Build shifts around ticket counts, not habit. Review four weeks of sales by half-hour, then compare weekdays, weekends, and weather. Place an extra cook or cashier before the usual rush, and trim coverage when orders slow. The National Restaurant Association’s 2023 Restaurant Operations Data Abstract reported median labor costs of 31.7% of sales for limited-service restaurants in 2022. Treat that as a reference, not a target; wages and service models vary. Rushes move.
Tip: Track labor cost per bowl weekly. Divide all hourly wages and employer payroll costs by bowls sold during the same period. For example, $600 in labor across 300 bowls equals $2 per bowl. Include prep and closing hours, not just service shifts. Otherwise, your number may look better than reality. A POS sales report and a simple time-clock export are enough to start.
Compare peak and quiet shifts separately. If labor cost rises while bowls sold stay flat, adjust start times or cross-train staff for topping prep and checkout. Don’t cut a person just because one slow night distorts the average. Forecasts miss sometimes. Record the reason, then revisit the schedule next week.
Illustrative sample data showing how labor cost per bowl can vary across service periods.
Labor cost per bowl is lower during the busiest periods because more orders are handled with each scheduled labor hour. Use sales forecasts to align staffing with peak demand and review the metric regularly.
| Cookie | Duration | Description |
|---|---|---|
| cookielawinfo-checbox-analytics | 11 months | This cookie is set by GDPR Cookie Consent plugin. The cookie is used to store the user consent for the cookies in the category "Analytics". |
| cookielawinfo-checbox-analytics | 11 months | This cookie is set by GDPR Cookie Consent plugin. The cookie is used to store the user consent for the cookies in the category "Analytics". |
| cookielawinfo-checbox-analytics | 11 months | This cookie is set by GDPR Cookie Consent plugin. The cookie is used to store the user consent for the cookies in the category "Analytics". |
| cookielawinfo-checbox-functional | 11 months | The cookie is set by GDPR cookie consent to record the user consent for the cookies in the category "Functional". |
| cookielawinfo-checbox-functional | 11 months | The cookie is set by GDPR cookie consent to record the user consent for the cookies in the category "Functional". |
| cookielawinfo-checbox-functional | 11 months | The cookie is set by GDPR cookie consent to record the user consent for the cookies in the category "Functional". |
| cookielawinfo-checbox-others | 11 months | This cookie is set by GDPR Cookie Consent plugin. The cookie is used to store the user consent for the cookies in the category "Other. |
| cookielawinfo-checbox-others | 11 months | This cookie is set by GDPR Cookie Consent plugin. The cookie is used to store the user consent for the cookies in the category "Other. |
| cookielawinfo-checbox-others | 11 months | This cookie is set by GDPR Cookie Consent plugin. The cookie is used to store the user consent for the cookies in the category "Other. |
| cookielawinfo-checkbox-necessary | 11 months | This cookie is set by GDPR Cookie Consent plugin. The cookies is used to store the user consent for the cookies in the category "Necessary". |
| cookielawinfo-checkbox-necessary | 11 months | This cookie is set by GDPR Cookie Consent plugin. The cookies is used to store the user consent for the cookies in the category "Necessary". |
| cookielawinfo-checkbox-necessary | 11 months | This cookie is set by GDPR Cookie Consent plugin. The cookies is used to store the user consent for the cookies in the category "Necessary". |
| cookielawinfo-checkbox-performance | 11 months | This cookie is set by GDPR Cookie Consent plugin. The cookie is used to store the user consent for the cookies in the category "Performance". |
| cookielawinfo-checkbox-performance | 11 months | This cookie is set by GDPR Cookie Consent plugin. The cookie is used to store the user consent for the cookies in the category "Performance". |
| cookielawinfo-checkbox-performance | 11 months | This cookie is set by GDPR Cookie Consent plugin. The cookie is used to store the user consent for the cookies in the category "Performance". |
| viewed_cookie_policy | 11 months | The cookie is set by the GDPR Cookie Consent plugin and is used to store whether or not user has consented to the use of cookies. It does not store any personal data. |
| viewed_cookie_policy | 11 months | The cookie is set by the GDPR Cookie Consent plugin and is used to store whether or not user has consented to the use of cookies. It does not store any personal data. |