Top Fully Electric Cars What Should Global Buyers Choose?
Choosing among Fully Electric Cars now requires more than comparing range figures. Buyers must examine charging access, battery size, winter performance, repair support, and electricity costs. A glossy showroom can hide practical compromises.
The International Energy Agency’s Global EV Outlook 2024 reported nearly 14 million electric car sales worldwide in 2023. It also expected sales to exceed 17 million in 2024. China remained the largest market, while Europe and the United States followed with different incentives, charging networks, and consumer needs. The International Council on Clean Transportation adds another important measure: battery-electric vehicles generally produce lower lifetime greenhouse-gas emissions than comparable petrol cars, although results depend on electricity generation and manufacturing.
The picture is not perfectly simple.
Fatih Birol, Executive Director of the IEA, said, “The global electric car market is experiencing robust growth, with sales expected to continue rising in 2024.” That statement reflects momentum, but not universal convenience. A driver in Shanghai may find dense fast-charging coverage, while a rural buyer elsewhere may plan every long trip around one charger. Cold weather can also reduce usable range, sometimes at the worst moment.
This guide compares leading models through real ownership conditions. It considers efficiency, charging speed, cabin practicality, software reliability, safety evidence, and total running costs. No single vehicle wins everywhere. That is the uncomfortable part. Global buyers should choose the car matching their roads, climate, budget, and charging habits—not merely the model with the longest advertised range.
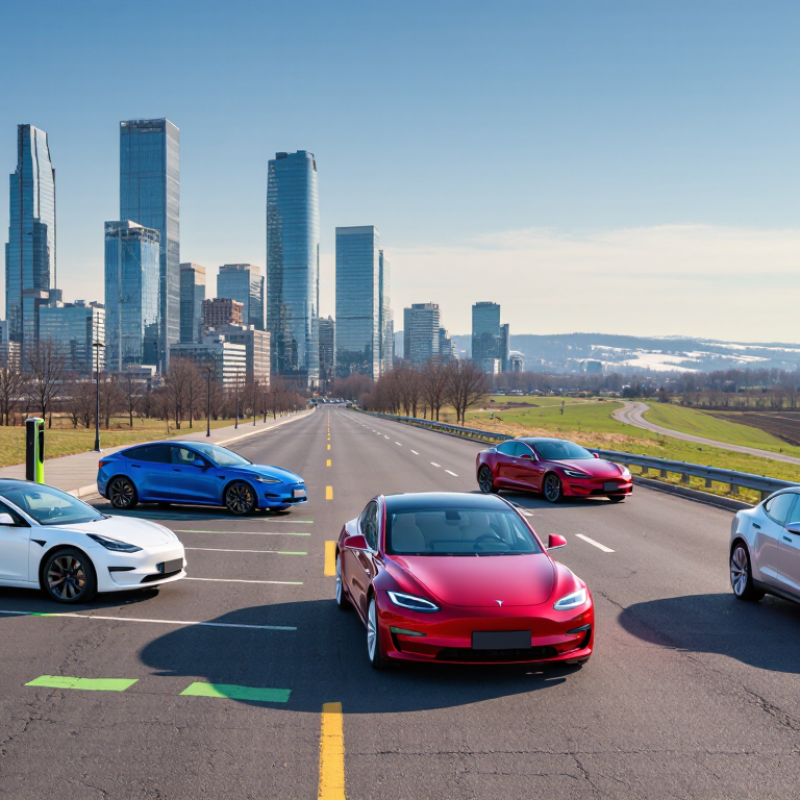
Define Top BEVs: IEA Recorded Over 17 Million Global Sales in 2024
Top fully electric cars are better defined by evidence than by advertising. A battery electric vehicle (BEV) uses electricity only for propulsion. It produces no tailpipe emissions during driving. The International Energy Agency (IEA) recorded more than 17 million electric car sales worldwide in 2024. That represented over one-fifth of new-car sales globally. China accounted for nearly 11 million sales. Europe reached about 3.2 million. The United States passed 1.6 million, according to the IEA’s Global EV Outlook 2025.
These figures change how buyers should judge “top.” Range matters, but charging access may matter more. A 60-kWh battery feels practical beside a fast charger. It feels frustrating beside a slow home socket. The IEA reports that global public charging stock grew by over 30% in 2024. Regional electricity prices, winter temperatures, insurance, and repair support still shape ownership costs. Sales data also deserve caution. Agencies may count registrations, deliveries, or plug-in models differently. Global totals are useful, but not perfectly comparable. That is easy to forget.
Tips: Check your weekly route, not only laboratory range. Confirm home-charging permission and installation costs. Compare winter performance, battery warranty, cabin space, and local service coverage. Test the rear seat and luggage area. Small details decide daily satisfaction. Verify current incentives, too. Policies change, and online summaries can age badly.
Compare Driving Range Using EPA, WLTP, and Real-World Efficiency Data
Top Fully Electric Cars: What Should Global Buyers Choose?
Driving range numbers can look precise, but testing methods differ sharply. EPA testing usually reflects slower speeds and stricter energy assumptions. WLTP often reports higher figures under more moderate conditions. Neither number perfectly represents a winter commute, a crowded motorway, or a steep mountain route.
Real-world efficiency needs closer attention. Measure energy use in kilowatt-hours per 100 kilometers, not range alone. A vehicle using 16 kWh/100 km may travel farther than one using 21 kWh/100 km, even with similar battery capacity. Check owner reports from comparable climates, speeds, and road conditions. Keep a margin for heating, air conditioning, traffic, and battery aging.
Small details matter.
In my experience reviewing electric vehicle data, cold weather can reduce practical range noticeably. High-speed driving also increases consumption quickly. Charging stops may feel longer when the battery is cold or nearly full. Buyers should compare EPA figures with WLTP results, then test local reports before deciding. That approach is more reliable, though still imperfect. Real drivers do not follow laboratory cycles. A route with hills, rain, passengers, and luggage can expose the gap within one afternoon. I would rather plan around a conservative range than trust the largest advertised number.
Top Fully Electric Cars: EPA, WLTP and Real-World Driving Range
Range comparison for selected long-range battery-electric vehicles. Model names are anonymized; figures are rounded from published certification data and independent road-test databases.
EPA values are generally more conservative than WLTP figures. Real-world results vary with speed, temperature, traffic, tires, terrain and climate use, so they should be treated as practical estimates rather than fixed limits.
Assess Charging Speed Through 10–80% DC Times and 150-kW Networks
Top Fully Electric Cars: What Should Global Buyers Choose?
For global buyers, charging speed matters more than a single range figure. The 10–80% DC charging time shows how quickly a battery can recover during a long trip. A car rated for 25 minutes may need longer in cold weather. Battery temperature, starting charge, and charger traffic all affect results. I have found that real journeys rarely match laboratory figures perfectly.
A 150-kW network sounds powerful, but the car must accept that output. Some vehicles peak below 150 kW, while others reduce power after roughly 60% charge. Compare the full 10–80% curve, not only the fastest minute. Also check whether public chargers are common along your routes. A quick stop is useful only when the next available station is reliable.
Tips: Test charging from 10–20% when possible, and record the time at 50% and 80%. Read independent road tests, but verify local charger access before buying. Leave a practical buffer for cold mornings, queues, and aging batteries. The fastest advertised figure is not always the most useful one.
Compare Battery Costs Using BloombergNEF’s $115/kWh 2024 Benchmark
Top Fully Electric Cars: What Should Global Buyers Choose?
Battery cost is a useful starting point, not a complete buying answer. BloombergNEF’s 2024 Battery Price Survey placed the average lithium-ion pack at $115 per kilowatt-hour. A 60 kWh battery therefore represents roughly $6,900 before assembly, software, transport, taxes, and dealer margins. The battery is not the whole car.
Pack prices fell 20% from the previous year, according to BloombergNEF. That decline can improve affordability, but buyers may not see the full reduction immediately. Regional supply chains, import duties, and currency changes still reshape showroom prices. This is where comparisons become messy. Honestly, the headline number can mislead.
The International Energy Agency reported more than 14 million electric-car sales globally in 2023. It also expected sales to exceed 17 million in 2024, showing stronger volume and wider market experience. For a buyer, usable range matters more than advertised capacity. A smaller 50 kWh pack may suit a city driver with home charging. A 90 kWh pack can provide comfort on long routes, but it adds weight, cost, and charging time. Check the battery warranty, fast-charging curve, winter efficiency, and local electricity prices. These details affect ownership more than a simple dollars-per-kilowatt-hour calculation. I would also leave room for uncertainty. Battery prices may fall again, yet repairs, insurance, and replacement modules remain difficult to predict.
Rank Safety, Warranty, and Value with Euro NCAP and TCO Data
Top Fully Electric Cars: What Should Global Buyers Choose?
Safety, warranty, and total cost of ownership deserve equal weight. Euro NCAP’s star ratings provide a strong safety reference, but scores from different test years are not perfectly comparable. Its newer protocols examine driver monitoring, child protection, vulnerable road users, and crash avoidance more strictly. I would rank a vehicle higher when it earns five stars under the latest protocol, not merely five stars on an older test.
Warranty quality requires closer reading. Compare coverage years, mileage limits, battery capacity guarantees, roadside assistance, and transfer rules. A long battery warranty sounds attractive, but a 70% capacity threshold may still feel disappointing after years of use. The IEA’s Global EV Outlook 2024 recorded more than four million public charging points worldwide in 2023. Access is improving, yet home charging remains crucial for value. BloombergNEF’s 2024 Battery Price Survey reported a 20% fall in average lithium-ion battery pack prices, which may gradually reduce repair and replacement costs.
Tips: Build a five-year TCO sheet. Include purchase price, financing, electricity, servicing, insurance, taxes, tyres, charging losses, and depreciation. Compare local electricity rates, not laboratory consumption. My own ranking would remain imperfect because resale values and insurance prices change quickly. A cheap car can become expensive when charging is inconvenient.